Is there an ideal approach to multiple ecosystem services?
May 3, 2011 6 Comments
Ecosystem services are based in time and, mostly, space. As such, they can be mapped. Developing these maps in a scientifically reliable way is part of the key to developing ways to measure, baseline and monitor ES in a way that can ultimately lead to better informed policy and decision making to sustain our global systems, as well as the ES they provide.
I came across some news today that Martin Prince, 2007 Nobel Peace Prize winner, is advocating that “mountain specific planning is needed to ensure the flow of ecosystem services.” Mountain specific planning… Hmm. This got me thinking:
Is there an ideal method of looking at ecosystem services in an integrated way that would make sense for multiple ecosystem services attributes?
As such, could we group water, soil, biodiversity, timber, medicinal, cultural etc ecosystem services together in a way that would be useful for each? Would we be best to go large and group by biome? Group by mountain? Group by watershed? Group by underlying soil type? These are examples of some of the approaches we could take, and any would likely be allow us to have a way to break down ecosystems and manage our actions on them appropriately and sustainably.
As far as individual ecosystem services attributes I’ve seen different maps of various ES parameters, such as:
Soil
Soil Carbon
Fresh Water
Biodiversity
A Combined ES Approach
As you can see from the above maps, they look great and allow us to get a global snapshot of various ecosystem parameters that underlie natural capital and flows of ecosystem services. There are also more localized regional maps that can be found, but if the maps are produced by different groups, it can start to become rather unwieldy to try and overlay them and get an idea of what land might be priority for protecting ecosystem services.
So what about a combined approach to more than one ES parameter at a time? In many cases, these parameters will be quite location specific such as this map below that shows carbon and a specific species, caribou. The Canadian Boreal Initiative and the Boreal Songbird Initiative have produced this work that looks at both carbon and caribou habitat in order to help determine areas of the boreal forest in Canada that may be priority for conservation. The map below shows carbon in brown, and the woodland caribou and barren ground caribou ranges are shown with different green patterns.
Another study by UNEP, WCMC, the German Federation for Nature Conservation and other partners has produced an Interactive Tool that combines both carbon and biodiversity in general. Their map below indicates areas of the globe where they have completed studies, or have studies in development.
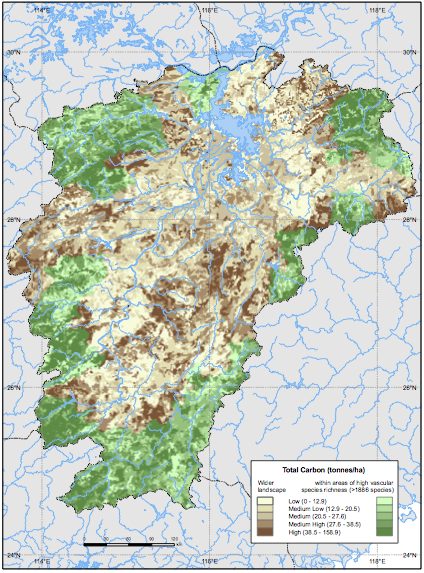
On the above map, you can see a purple area in China. That is Jiangxi Province, and here is a link to that project where they have mad a map for that region focusing on carbon and vascular plants. If you click on the previous link at the top of this paragraph you can find the link to the actual pdf map on that page, but I’ve pasted a smaller copy below for convenience. As can be seen on the map of Jiangxi, when you overlay carbon and biodiversity layers on the map, you can start to see if there are certain areas within regions that are hotspots for multiple ecosystem services that should be a priority for protection. The dark brown areas represent areas of high carbon, but the dark green areas contain both high carbon and high biodiverisity.
This is where this approach can start to become a useful tool for local to international policy and decision makers who are facing significant challenges, such as not meeting the targets for the Convention on Biological Diversity in 2010. When you overlay multiple ecosystem services attributes, and find a way to rank important or threatened ones, then you can start to form a clear picture of where you need to concentrate your resources and action for protection.
Another interesting and potentially useful approach I have seen is in some great work I’ve recently seen mapping ecosystem services by watershed. I will be following up with a blog post soon with examples of recent research on mapping ecosystem services using this watershed approach as I feel it deserves a separate treatment. Stay tuned…


